When patients receive test results from different laboratories and notice the numbers don't match exactly, a natural question arises: "Which one is correct?"
The Reality of Laboratory Testing: Variation Is Expected
Why Does This Happen?
Several factors contribute to inter-laboratory variation [1]:
- Different analyzer platforms: Each manufacturer's instrument has unique measurement characteristics
- Method differences: Immunoassays, chromatography, and mass spectrometry may yield slightly different results
- Calibration variations: Labs calibrate to reference standards, but small differences persist between systems
- Reagent lot variability: Different batches of reagents can introduce minor measurement differences
- Sample handling: Collection method, timing, temperature, and processing can all affect results
These factors don't indicate poor quality, they reflect the reality that no two measurement systems are identical, even when both meet rigorous certification standards [1].
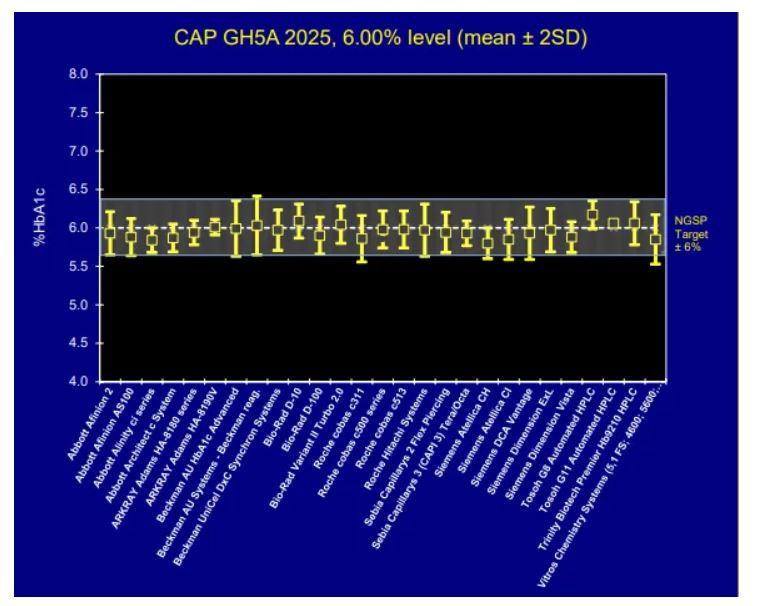
Examine Real Data: HbA1c Proficiency Testing
The College of American Pathologists (CAP) conducts proficiency testing surveys where more than 2,600 laboratories using 27 different NGSP-certified analyzer methods measured identical standardized blood samples with a true value of 6.00%. Yet their results range from approximately 5.6% to 6.4% [1].
CAP accreditation requires HbA1c results to fall within ±6% of the NGSP target value [1]. For a true value of 6.00%, this means results from 5.64% to 6.36% are all considered acceptable.
This Pattern Extends Beyond HbA1c
While HbA1c provides an excellent case study due to extensive proficiency testing data, similar variation exists across virtually all laboratory biomarkers:
Lipoprotein(a)
Lp(a) is one of the most challenging biomarkers to measure consistently across laboratories. A 2025 CDC study documented inter-laboratory variation ranging from 3.3% to 69.1% across clinical assays [2].
Learn more: Why Lipoprotein(a) Results Can Differ Between Laboratories
Lipid Panels
LDL cholesterol, a key cardiovascular disease marker, presents unique measurement challenges:
- Multiple calculation equations exist: The Friedewald equation, Martin-Hopkins equation, and NIH/Sampson equation can yield different results from the same sample. Mayo Clinic Laboratories notes that "adjusted LDL-C calculations, like the Sampson/NIH equation, are endorsed by multiple guidelines as being more accurate when triglycerides are greater than 150 mg/dL and/or LDL-C is less than 70 mg/dL." [3]
- Mayo Clinic Proceedings (2023) found that classification of patients around clinically relevant cut-points can depend solely on which equation is used. For patients with ASCVD, 5.1% had their classification as above or below 70 mg/dL depend solely on the equation used [4]
- Cleveland Clinic Journal of Medicine (June 2025) states: "Laboratory test inaccuracy due to LDL-C variations in fasting vs non-fasting states can make a patient appear to be statin-hyporesponsive. It is essential to repeat testing on multiple occasions and note the fasting state so that LDL-C values can be compared over time." [5]
- Direct LDL methods may differ from calculated values, particularly in patients with elevated triglycerides. The Friedewald equation is not recommended for triglycerides >400 mg/dL [6]
Hormone Testing
Hormone measurements show significant method-dependent variation:
- Cleveland Clinic Laboratories explicitly advises when changing testosterone assay methods: "Results should not be compared to previously reported results using Cleveland Clinic's assay due to differences in methodology. Interpret the result using the reference range provided by the performing laboratory." [7]
- Mayo Clinic Laboratories states that "total testosterone levels are a relatively crude guideline for therapy and can be misleading" [8] and notes that free testosterone measurement by equilibrium dialysis method is "time-consuming, flawed by minor impurities and technical variables, and unavailable to most clinicians." [9]
- Reference ranges differ between laboratories: Cleveland Clinic notes: "It's important to note that the normal ranges for testosterone levels can vary based on the type of blood test done and the laboratory where it is done." [10]
- A number of conditions and medications can increase or decrease sex hormone-binding globulin (SHBG) concentration, which may cause total testosterone concentration to change without necessarily influencing bioavailable or free testosterone concentration [8]
Vitamin Levels
Vitamin testing presents ongoing standardization challenges:
- Vitamin D: Despite years of effort through the Vitamin D Standardization Program (VDSP), "the intra- and inter-laboratory variability is still high (especially at low vitamin D concentrations) which might lead to incorrect vitamin D deficiency/insufficiency diagnosis." Immunoassay instruments have shown biases as high as ±30% from NIST-assigned target values, while LC-MS/MS methods show lower bias (within ±15%) [11]
- The VDSP notes: "We are still far from having a worldwide vitamin D assay standardization that is capable to provide reliable measurements with a bias within the desirable ±5% range." [11]
- Vitamin B12: Mayo Clinic Laboratories notes "the analytic variability CV of both serum and RBC folate assays is considerable" and importantly states that "a normal serum concentration of vitamin B12 does not rule out tissue deficiency of vitamin B12. The most sensitive test for vitamin B12 deficiency at the cellular level is the assay for methylmalonic acid (MMA)." [12]
- Patients who have received a vitamin B12 injection within the previous 2 weeks may have falsely elevated results due to assay interference [13]
- Results from different labs should not be directly compared, use the same laboratory for trend monitoring [14]
Clinical Interpretation: Focus on What Matters
The key insight is that clinical interpretation should focus on the diagnostic category, not the precise number [15].
Example: HbA1c and Diabetes Classification
According to the Cleveland Clinic, Mayo Clinic, and American Diabetes Association [16, 17]:
A1C Level Classification
Below 5.7% Normal
5.7% – 6.4% Prediabetes
6.5% or higher Diabetes
If one laboratory reports 5.7% and another reports 6.3%, both results indicate prediabetes. The clinical message is the same: blood sugar management deserves attention.
In these borderline cases, clinicians typically [15]:
- Repeat testing at the same laboratory
- Consider clinical context and other risk factors
- Use additional diagnostic criteria (fasting glucose, oral glucose tolerance test)
Recommendations for Patients
1. Use the Same Laboratory for Trend Monitoring
The most important recommendation is to use the same laboratory when tracking biomarkers over time [1, 15]. This eliminates inter-laboratory variation and gives you the clearest picture of true changes in your health.
2. Don't Panic Over Differences
If results from two laboratories differ by amounts within the expected variation (e.g., 0.3–0.6% for HbA1c), this is normal and doesn't indicate a problem with either test [1].
3. Focus on Clinical Categories
Ask yourself: "Do both results place me in the same clinical category?" If yes, the message is consistent regardless of the numerical difference.
4. Discuss Concerns with Your Healthcare Provider
If you're concerned about discrepant results, your healthcare provider can help interpret them in the context of your overall health picture.
5. Verify Laboratory Certification
Ensure your laboratory is CLIA-certified and, ideally, CAP-accredited. This confirms they meet rigorous quality standards and participate in proficiency testing programs.
References
1. College of American Pathologists (CAP). GH5 Survey Data 2025. https://ngsp.org/CAP/CAP25a.pdf
2. Lyle AN, et al. Interlaboratory comparison of serum lipoprotein(a) analytical results across clinical assays—Steps toward standardization. Journal of Clinical Lipidology. 2025. https://www.sciencedirect.com/science/article/abs/pii/S1933287425000327
3. Mayo Clinic Laboratories. Cholesterol, Low-Density Lipoprotein (LDL), Calculated, Serum. https://www.mayocliniclabs.com/test-catalog/overview/617023
4. Zheutlin AR, Niforatos JD. Equation-Based Low-Density Lipoprotein Cholesterol Reclassification and Implications For Lipid-Lowering Therapy. Mayo Clinic Proceedings. 2023. https://www.mayoclinicproceedings.org/article/S0025-6196(23)00256-2/fulltext
5. Cleveland Clinic Journal of Medicine. My adult patient's hypercholesterolemia is not responding to statins—what's next? June 2025, 92(6):347-351. https://doi.org/10.3949/ccjm.92a.24117
6. Sampson M, et al. A new equation for calculation of low-density lipoprotein cholesterol in patients with normolipidemia and/or hypertriglyceridemia. JAMA Cardiology. 2020;5(5):540-548. https://pmc.ncbi.nlm.nih.gov/articles/PMC7240357/
7. Cleveland Clinic Laboratories. Update: Changes to Testosterone, Free & Total, Testing and Reporting. December 2021. https://clevelandcliniclabs.com/update-changes-to-testosterone-free-total-testing-and-reporting/
8. Mayo Clinic Laboratories. Testosterone, Total and Free, Serum (TGRP). https://www.mayocliniclabs.com/test-catalog/overview/8508
9. Beckman TJ, et al. Erectile Dysfunction and Testosterone—Reply. Mayo Clinic Proceedings. 2006;81(6):826-827. https://www.mayoclinicproceedings.org/article/S0025-6196(11)61747-3/fulltext
10. Cleveland Clinic. Testosterone: What It Is, Function & Levels. https://my.clevelandclinic.org/health/articles/24101-testosterone
11. Cesareo R, et al. Concerning the vitamin D reference range: pre-analytical and analytical variability of vitamin D measurement. Biochemia Medica. 2017;27(3):030501. https://pmc.ncbi.nlm.nih.gov/articles/PMC5575654/
12. Mayo Clinic Laboratories. Vitamin B12 and Folate, Serum (FB12). https://www.mayocliniclabs.com/test-catalog/overview/9156
13. Mayo Clinic Laboratories. Vitamin B12 Assay, Serum (B12). https://www.mayocliniclabs.com/test-catalog/overview/9154
14. Wise SA, et al. Vitamin D Standardization Program (VDSP) Intralaboratory Study for the Assessment of 25-Hydroxyvitamin D Assay Variability and Bias. J Steroid Biochem Mol Biol. 2021;212:105917. https://pmc.ncbi.nlm.nih.gov/articles/PMC8403635/
15. Sacks DB, et al. Guidelines and Recommendations for Laboratory Analysis in the Diagnosis and Management of Diabetes Mellitus. Diabetes Care. 2023. https://doi.org/10.2337/dci23-0048
16. Cleveland Clinic. Hemoglobin A1C (HbA1c) Test. https://my.clevelandclinic.org/health/diagnostics/9731-a1c
17. Mayo Clinic. A1C Test. https://www.mayoclinic.org/tests-procedures/a1c-test/about/pac-20384643
No comments yet. Be the first!